9 Doppler Positions
A lot of ink has been spilled on the accuracy of Argos doppler positions. I won’t try to summarize that literature here. Instead, I’ll include a couple of plots to demonstrate the particular qualities of the data for Z. cavirostris and G. macrorhynchus off Cape Hatteras and some practical advice for filtering.
9.1 The “X”
library(colorspace)
library(leaflet)

# load data
load("examples/ex_ziphius_argos_pos.RData")

uqual <- unique(zloc$Quality)
colors <- colorspace::rainbow_hcl(length(uqual))
cols <- 1:nrow(zloc)*NA

for(i in 1:length(uqual)) {
  dese <- zloc$Quality == uqual[i]
  cols[dese] <- colors[i]
}

# make a plot
m <- leaflet()
m <- addTiles(m, urlTemplate="http://server.arcgisonline.com/ArcGIS/rest/services/World_Imagery/MapServer/tile/{z}/{y}/{x}")
m <- addCircleMarkers(m, lng = zloc$Longitude, lat = zloc$Latitude,
     popup = paste("lq =", zloc$Quality),
     radius = 6,
     stroke = FALSE,
     fillOpacity = 0.75,
     color = cols
)
m <- addLegend(m, "bottomleft", colors = colors, labels = uqual, opacity = 1)
m
Figure 9.1: 2017 Z. cavirostris unfiltered Argos positions.
9.2 Error ellipses
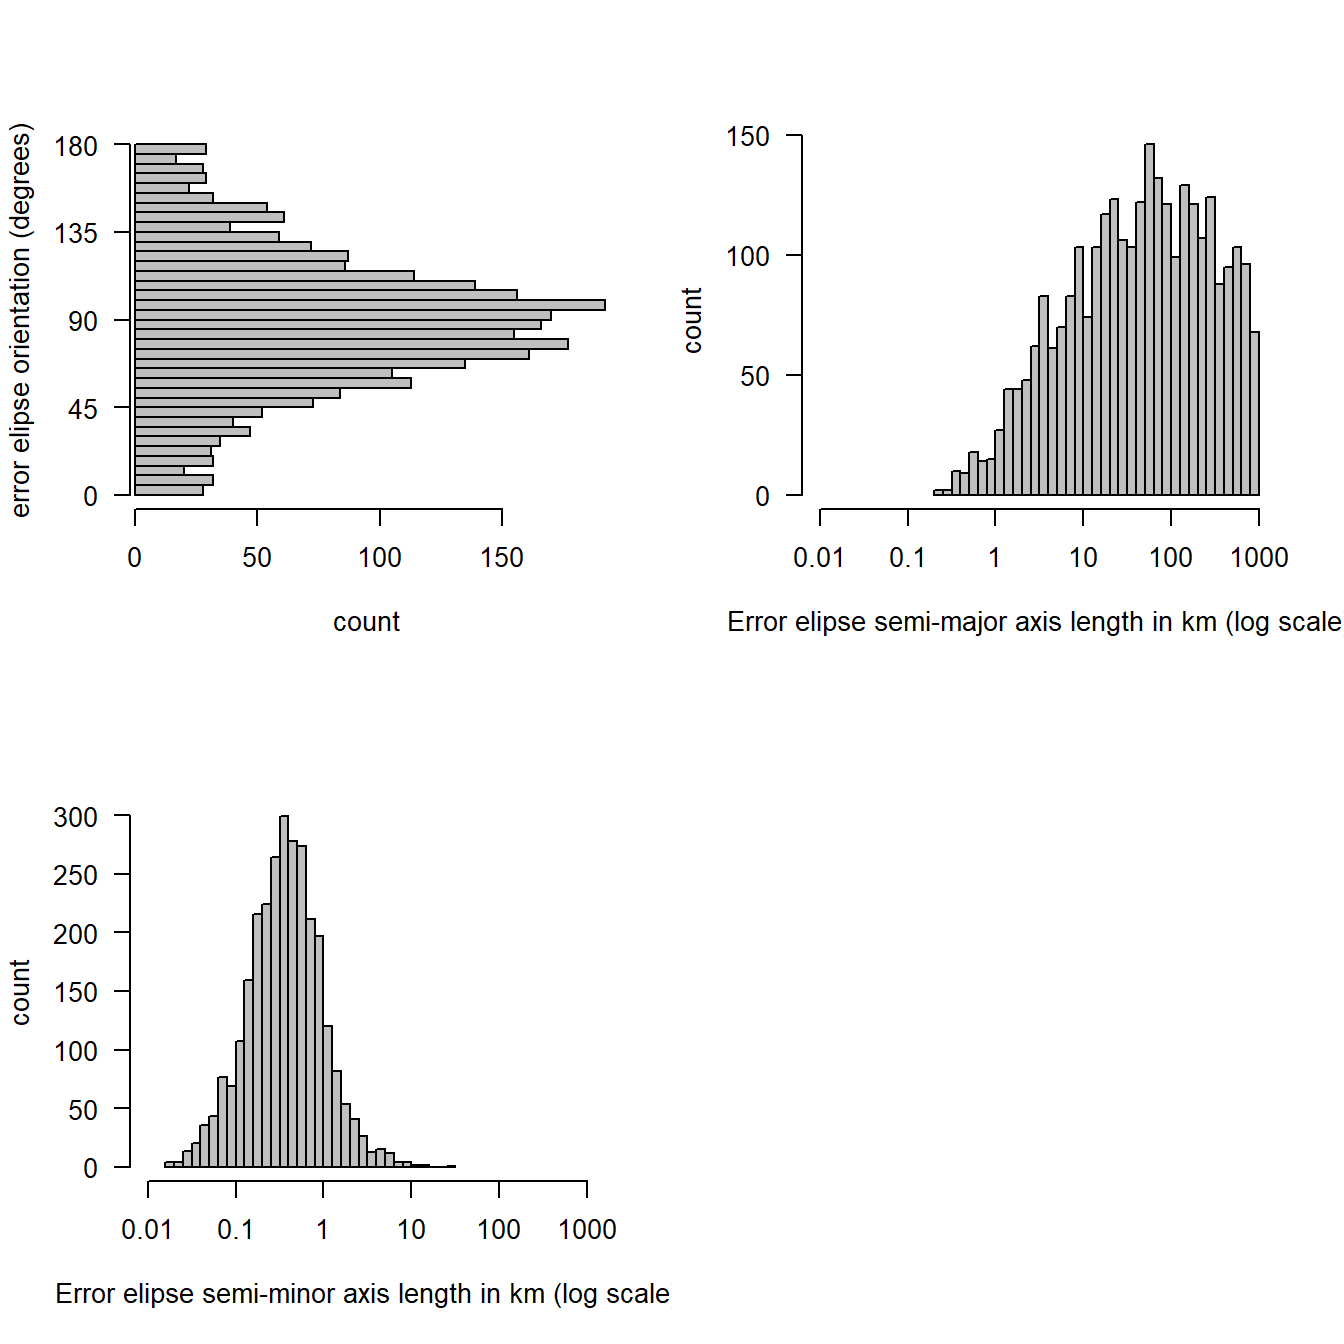
Argos satellite are in polar orbits and therefore error tends to be higher in the east-west direction than the north-south direction.
par(mfrow = c(2, 2))

xhist <- hist(zloc$Error.Ellipse.orientation, nclass = 50, plot = FALSE)

barplot(
  xhist$counts,
  axes = TRUE, horiz = TRUE,
  space = 0, xlab = "count",
  ylab = "error elipse orientation (degrees)",
  col = "grey75"
)
axis(2, at = c(0, length(xhist$counts)/4, length(xhist$counts)/2, 3*(length(xhist$counts)/4), length(xhist$counts)), lab = c(0, 45, 90, 135, 180), las = 1)

hist(log(zloc$Error.Semi.major.axis, base = 10), nclass = 50, xlim = c(1, 6), col = "grey75", axes = FALSE, xlab = "Error elipse semi-major axis length in km (log scale)", ylab = "count", main = "")
axis(2, las = 1)
axis(1, at = 1:6, lab = 10^(1:6)/1000)

hist(log(zloc$Error.Semi.minor.axis, base = 10), nclass = 25, xlim = c(1, 6), col = "grey75", axes = FALSE, xlab = "Error elipse semi-minor axis length in km (log scale)", ylab = "count", main = "")
axis(2, las = 1)
axis(1, at = 1:6, lab = 10^(1:6)/1000)
Figure 9.2: Error ellipse orientation and error distribution for 2017 Z. cavirostris unfiltered Argos positions.